Analytical Queries using Entity Framework over Date Ranges using Linq

Greg Roberts
Greg RobertsThe other day I decided to start doing some analytics style queries purely in Linq against my existing normalized structure. Normally these types of queries are best suited on a Star Schema, but I think for what I wanted it was simple enough to do in the transactional tables, plus most sites don’t have a true “data warehouse” anyways.
First lets go over what I was looking to do.
For a given date range, get the total number of logins per day. Use only Linq in my EF model ( no stored procedures). Most processing should happen in the DB I know what you are thinking, that is super simple. I agree it is, but there are some hidden complexities that I think are worth sharing.
First lets look at the table that we will mostly be using:
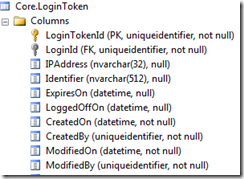
This is essentially my session table. Each time a user logs in, a record is created that ties into a “Login” entity.
In plain english I want a query that counts the total amount of these records grouped by date part of the “CreatedOn” column for a given date range.
Here is how I accomplished the query in Linq, ignore the class I’m using to project the result:
The key points of this query are as follows:
Linq to EF won’t let you do a group by l.CreatedOn.Date, so you need to group by multiple keys on year, month, day You can then order the results with these keys You can’t initiate a DateTime object in your projection since it doesn’t have a parameterless constructor. I wanted to have the result of count and Datetime, but ended up with breaking the date parts out because of this. Now most people might say, hey great job I’m done, was that really worth a blog post? Well maybe not until you look at the results and realize that if you had no data for a particular day (no logins) you will have a gap. This is really important when graphing results because that 0 for a day becomes crucial to displaying an accurate line graph.
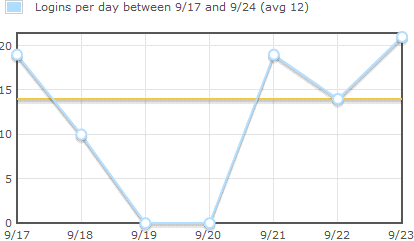
To illustrate in the following graph, the data for 9/19 – 9/20 shows the correct 0 value, but if I didn’t fix the problem then the line would draw directly from 9/18 to 9/21 which would be incorrect.
To fix this in code it’s as simple as doing a union of your results with another list of the same type with data for all dates and a 0 count.
Here’s a simple workaround. First create your date range list. Essentially keep looping until start equals stop.
Now taking the results from your EF query, union them with this “gap” list
Keep in mind that you will want to do the Hash on a particular property and not on the whole object in this case.
And that is it… We created our list with datetime and count for all days between a date range.
This ran really quick for me, but obviously if you are going to do a huge date range then this technique may not be the best, but it is good to have in your belt.
Happy coding.